EDH 7916: Contemporary Research in Higher Education
Spring 2023
A course in quantitative research workflow for students in the higher education administration program at the University of Florida
Overview Course information Meeting location Software Schedule Lessons Assignments Questions Past courses About
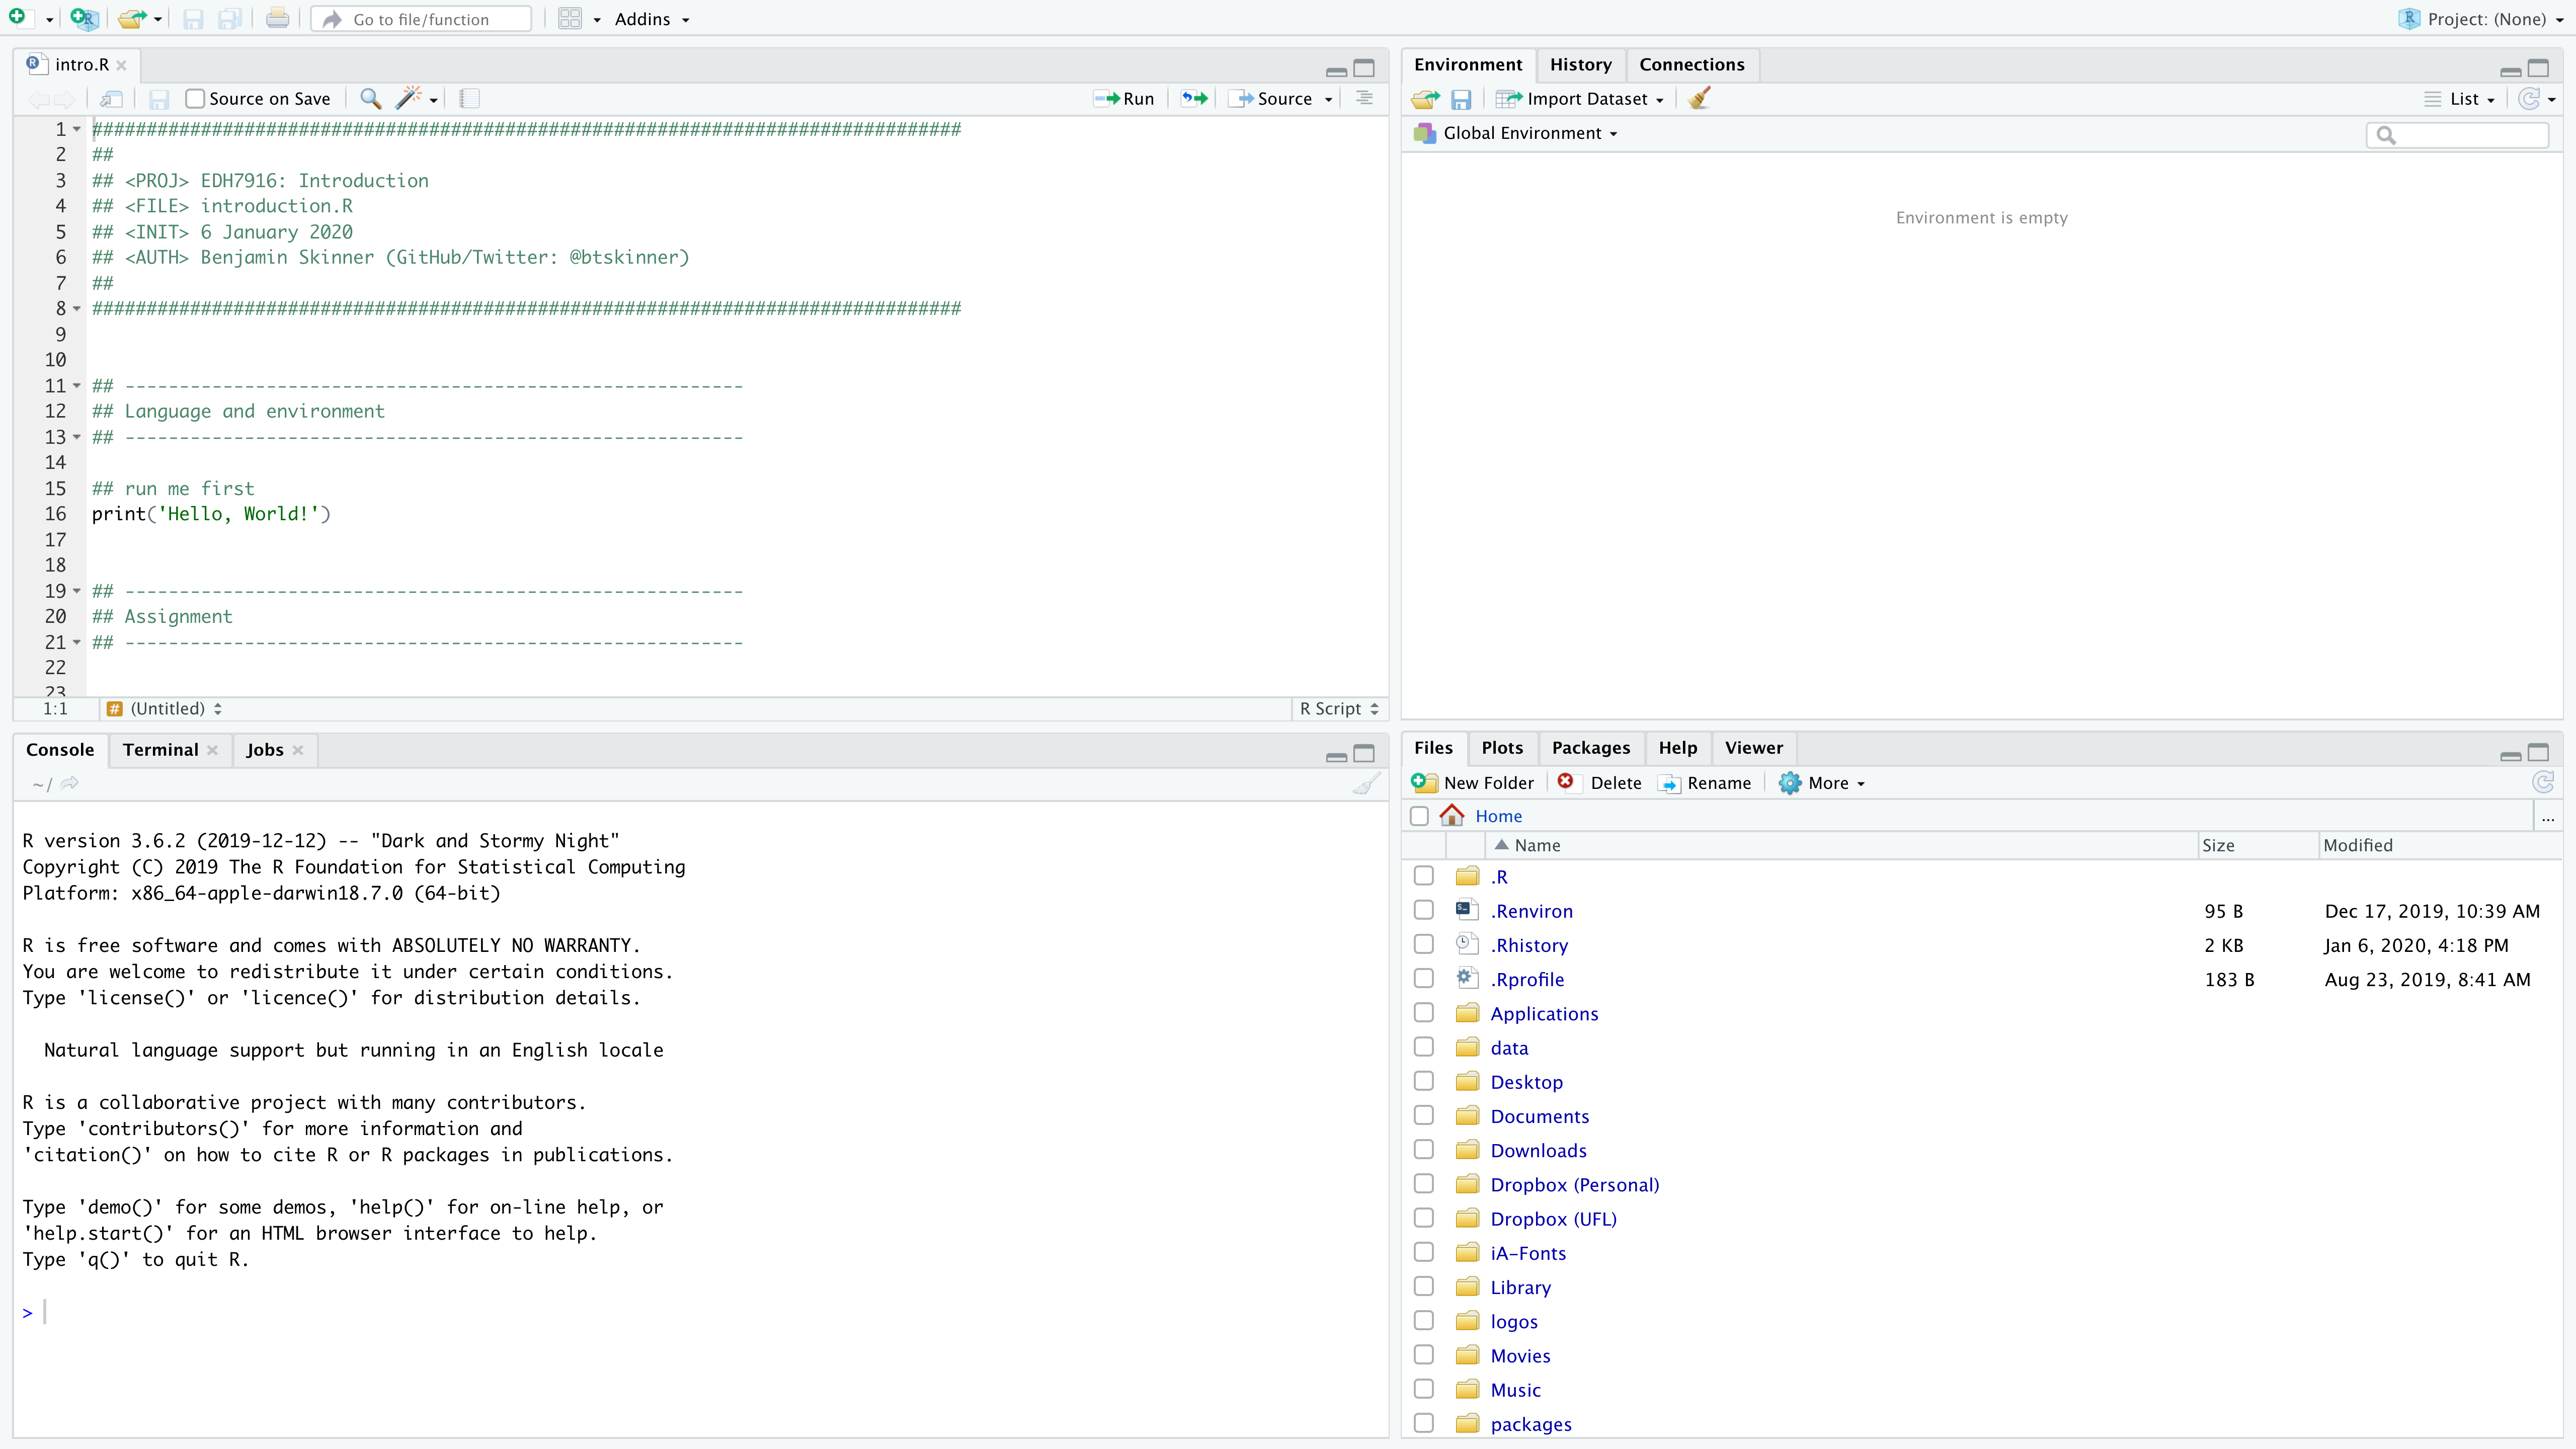
Introduction to R
print('Hello, World!')
## [1] "Hello, World!"
R is a port of the S language, which was developed at Bell Labs. As a GNU project, R is open source and free to use and distribute. It can be installed and used on most major operating systems.
R is best thought of as an integrated language and environment that was designed with statistical computing and data analysis in mind. To that end, its structure is a balance between powerful mathematical computation and high-level functionality that can be used interactively (unlike compiled code). In other words, it’s a great tool for quantitative data analysis since it both allows you to investigate your data easily and, when the time comes, write robust programs.
Originally, R was probably best known for its graphing capabilities. As it has matured, it has grown in popularity among data scientists, who have increasingly extended its functionality through user-contributed packages. We will use a number of packages during this course.
RStudio: an integrated development environment (IDE) for R
To work with the R language, it helps to have an application. While R ships with one (you may have seen it on your computer after you installed R), it’s pretty plain. RStudio, on the other hand, is a powerful integrated design environment (IDE) that does most everything R-related very well and with little fuss: run commands, write scripts, view output, interact with other languages and remote site, etc. There are other options for working with R, but RStudio is a great all-around program that we will use in this course.
RStudio has 3-4 main frames:
- Console
- Script window (will be closed at first if you don’t have any scripts open)
- Environment / History / Connections
- Files / Plots / Packages / Help / Viewer
Each has a useful purpose, but for today, we’ll mostly focus on the console itself.
Quick exercise
If you haven’t already, try entering an equation in the console (like
1 + 1). Next, open the script associated with this module and run the first line. Welcome to R!
Assignment
R is a type of object-oriented programming environment. This means that R thinks of things in its world as objects, which are like virtual boxes in which we can put things: data, functions, and even other objects.
Before discussing data types and structures, the first lesson in R is
how to assign values to objects. In R (for quirky
reasons),
the primary means of assignment is the arrow, <-, which is a less
than symbol, <, followed by a hyphen, -.
## assign value to object x using <-
x <- 1
NOTE: You can also use a single equals sign, =, to assign a
value to an object: x = 1. Keep in mind, however, that since =
sometimes has other meanings in R and can be confused with ==, which
is different, it’s generally clearer to use <-.
But’s where’s the output?
R does exactly what you ask it to do — no more, no less. If you don’t ask it to return something, either explicitly from a function or implicitly by printing to the console, it won’t. This can be huge source of frustration to new users.
The good-ish news is that by default, R will print an object’s contents to the console if it’s the only thing you type in. Many functions similarly print to the console if you don’t assign the output to an object. You can see this when simply type a number or character into the console.
## when you input a number or character, R returns it back to you
1
## [1] 1
"a"
## [1] "a"
Basically, you’ve just told R “Here’s a 1” and R said “The content
of 1 is 1”. Same for "a". The initial number in the square
brackets ([1]) is telling you the index (place within the object) of
the first item. Since we only have one item, it’s just [1].
When you store something in an object, you can type the object’s name into the console to see what’s in it.
## what's in x?
x
## [1] 1
A neat trick if you want to both assign a value and see the results
printed to the output is to to wrap the entire line in ().
## wrap in () to print after assignment
(x <- 5)
## [1] 5
Quick exercise
Using the arrow, assign the output of
1 + 1tox. Next subtract 1 fromxand reassign the result tox. Show the value inx.
A NOTE ON “GOOD-ISH” Keep in mind how much data your object has /
might have when printing it to the console. For a small amount,
printing is just fine. But if you have, for example, a matrix with
1,000 columns and 1 million rows, printing might not be a useful
exercise. There are other ways, such as the function head() that
might be more useful in these situations.
Comments
You may have noticed already, but comments in R are set off using the
hash or pound character at the beginning of the line: #. The comment
character tells R to ignore the line, that is, do not try to interpret
it as code you the user want run.
Quick exercise
Type the phrase “This is a comment” directly into the R console both with and without a leading “#”. What happens each time?
You may notice that I use two hashes. This is a stylistic tick that
has more to do with the editor I use than an R requirement. You can
use only a single # for your comments if you like.
Data types and structures
R uses variety of data types and structures to represent and work with data. There are many, but the major ones that you’ll use most often are:
logicalnumeric(integer&double)charactervectormatrixlistdataframe
Understanding the nuanced differences between data types is not important right now. Just know that they exist and that you’ll gain an intuitive understanding of them as you become better aquainted with R.
Packages
User-submitted packages are a huge part of what makes R great. You may hear me use the phrases “base R” during class. What I mean by this is the R that comes as you download it with no packages loaded (sometimes also called “vanilla R”). While it’s powerful in and of itself — you can do everything you need with base R — most of your scripts will make use of one of more contributed packages. These will make your data analytic life much nicer. We’ll lean heavily on the tidyverse suite of packages this semester.
Installing packages from CRAN
Many contributed packages are hosted on the CRAN package repository. What’s really nice about CRAN is that packages have to go through quite a few checks in order for CRAN to approve and host them. Checks include making sure the package has documentation, works on a variety of systems, and doesn’t try to do odd things to your computer. The upshot is that you should feel okay downloading these packages from CRAN.
To download a package from CRAN, use:
install.packages("<package name>")
NOTE Throughout this course, if you see something in triangle
brackets (<...>), that means it’s a placeholder for you to change
accordingly.
Many packages rely on other packages to function properly. When you
use install.packages(), the default option is to install all
dependencies. By default, R will check how you installed R and
download the right operating system file type.
Quick exercise
Install the
tidyversepackage, which is really a suite of packages that we’ll use throughout the semester. Don’t forget to use double quotation marks around the package name:install.packages("tidyverse")
Loading package libraries
Package libraries can loaded in a number of ways, but the easiest it to write:
library("<library name>")
where "<library name>" is the name of the package/library. You will
need to load these before you can use their functions in your
scripts. Typically, they are placed at the top of the script file.
For example, let’s load the tidyverse library we just installed:
## load library (note quirk that you don't need quotes here)
library(tidyverse)
## ── Attaching packages ─────────────────────────────────────── tidyverse 1.3.2 ──
## ✔ ggplot2 3.4.0     ✔ purrr   1.0.1
## ✔ tibble  3.1.8     ✔ dplyr   1.1.0
## ✔ tidyr   1.3.0     ✔ stringr 1.5.0
## ✔ readr   2.1.3     ✔ forcats 1.0.0
## ── Conflicts ────────────────────────────────────────── tidyverse_conflicts() ──
## ✖ dplyr::filter() masks stats::filter()
## ✖ dplyr::lag()    masks stats::lag()
Notice that when you load the tidyverse (which, again, is actually loading a number of other libraries), you see a lot of output. Not all packages are this noisy, but the information is useful here because it shows all the libraries that are now loaded and ready for you to use.
Help
I don’t have every R function and nuance memorized, so I certainly don’t expect that you will. With all the user-written packages, it would be difficult to keep up if I tried! When stuck, there are a few ways to get help.
Help files
In the console, typing a function name immediately after a question mark will bring up that function’s help file (in RStudio, you should see in the bottom right facet):
## get help file for function
?median
## Median Value
##
## Description:
##
##      Compute the sample median.
##
## Usage:
##
##      median(x, na.rm = FALSE, ...)
##
## Arguments:
##
##        x: an object for which a method has been defined, or a numeric
##           vector containing the values whose median is to be computed.
##
##    na.rm: a logical value indicating whether 'NA' values should be
##           stripped before the computation proceeds.
##
##      ...: potentially further arguments for methods; not used in the
##           default method.
##
## Details:
##
##      This is a generic function for which methods can be written.
##      However, the default method makes use of 'is.na', 'sort' and
##      'mean' from package 'base' all of which are generic, and so the
##      default method will work for most classes (e.g., '"Date"') for
##      which a median is a reasonable concept.
##
## Value:
##
##      The default method returns a length-one object of the same type as
##      'x', except when 'x' is logical or integer of even length, when
##      the result will be double.
##
##      If there are no values or if 'na.rm = FALSE' and there are 'NA'
##      values the result is 'NA' of the same type as 'x' (or more
##      generally the result of 'x[NA_integer_]').
##
## References:
##
##      Becker, R. A., Chambers, J. M. and Wilks, A. R. (1988) _The New S
##      Language_.  Wadsworth & Brooks/Cole.
##
## See Also:
##
##      'quantile' for general quantiles.
##
## Examples:
##
##      median(1:4)                # = 2.5 [even number]
##      median(c(1:3, 100, 1000))  # = 3 [odd, robust]
Two question marks will search for the command name in CRAN packages (again, in the bottom right facet):
## search for function in CRAN
??median
| Package | Topic | Title |
|---|---|---|
| bit64 | qtile | (Q)uan(Tile)s |
| broom | tidy.mediate | Tidy a(n) mediate object |
| distributional | median.distribution | Median of a probability distribution |
| ellipsis | safe_median | Safe version of median |
| future | readImmediateConditions | Read All ‘immediateCondition’ RDS Files |
| future | sticky_globals | Place a sticky-globals environment immediately after the global environment |
| ggdist | point_interval | Point and interval summaries for tidy data frames of draws from distributions |
| ggplot2 | hmisc | A selection of summary functions from Hmisc |
| googledrive | drive_put | PUT new media into a Drive file |
| httr | guess_media | Guess the media type of a path from its extension. |
| httr | parse_media | Parse a media type. |
| igraph | time_bins.sir | SIR model on graphs |
| matrixStats | rowMedians | Calculates the median for each row (column) in a matrix |
| matrixStats | rowWeightedMedians | Calculates the weighted medians for each row (column) in a matrix |
| matrixStats | weightedMad | Weighted Median Absolute Deviation (MAD) |
| matrixStats | weightedMedian | Weighted Median Value |
| officer | media_extract | Extract media from a document object |
| officer | sanitize_images | Remove unused media from a document |
| posterior | ess_quantile | Effective sample sizes for quantiles |
| posterior | mcse_quantile | Monte Carlo standard error for quantiles |
| posterior | rvar-summaries-over-draws | Summaries of random variables within array elements, over draws |
| posterior | rvar-summaries-within-draws | Summaries of random variables over array elements, within draws |
| purrr | accumulate | Accumulate intermediate results of a vector reduction |
| R.rsp | Non-documented objects | Non-documented objects |
| recipes | case-weight-helpers | Helpers for steps with case weights |
| recipes | step_impute_median | Impute numeric data using the median |
| recipes | tidy.step_BoxCox | Tidy the Result of a Recipe |
| tidybayes | reexports | Objects exported from other packages |
| tidybayes | tidybayes-deprecated | Deprecated functions, arguments, and column names in tidybayes |
| zoo | rollmean | Rolling Means/Maximums/Medians/Sums |
| zoo | zoo | Z’s Ordered Observations |
| stats | mad | Median Absolute Deviation |
| stats | median | Median Value |
| stats | medpolish | Median Polish (Robust Twoway Decomposition) of a Matrix |
| stats | runmed | Running Medians - Robust Scatter Plot Smoothing |
| stats | smooth | Tukey’s (Running Median) Smoothing |
| stats | smoothEnds | End Points Smoothing (for Running Medians) |
| survival | Math.Surv | Methods for Surv objects |
| survival | quantile.survfit | Quantiles from a survfit object |
At first, using help files may feel like trying to use a dictionary to see how to spell a word — if you knew how to spell it, you wouldn’t need the dictionary! Similarly, if you knew what you needed, you wouldn’t need the help file. But over time, they will become more useful, particularly when you want to figure out an obscure option that will give you exactly what you need.
Google it!
Google is a coder’s best friend. If you are having a problem, odds are a 1,000+ other people have too and at least one of them has been brave enough to ask about it in a forum like StackOverflow, CrossValidated, or R-help mailing list.
If you are lucky, you’ll find the exact answer to your question. More likely, you’ll find a partial answer that you’ll need to modify for your needs. Sometimes, you’ll find multiple partial answers that, in combination, help you figure out a solution. It can feel overwhelming at first, particularly if it’s a way of problem-solving that’s different from what you’re used to. But it does become easier with practice.
Google it!
Asking for help: order of operations
When needing help for this class, your order of operations should be:
- Try a lot on your own (perhaps using rubber duck debugging)
- R help files
- Class peers (directly or through our Issues page)
- Me
This is not because I don’t want to help. My concern is the opposite: that I’m likely to just show you. Data analysis is tricky because no two problems are alike. But over time, they do rhyme. The time you put in now learning to figure things out on your own will be well paid in the future.
Useful packages
We’re going to use a number of packages this semester. While we may need more than this list — and you almost certainly will in your own future work — let’s install these to get us started.
Quick exercise
Install the following packages using the
install.packages()function:
devtoolshereusethisgitcreds